In 2018, we worked with Blue Water Baltimore for four months, creating content for their social media accounts. Blue Water Baltimore’s mission is to restore the quality of Baltimore’s rivers, streams and harbor to foster a healthy environment, strong economy and thriving communities. They do great work in Baltimore and they’re truly passionate about making safe, clean water a reality within the county.
We managed their Facebook, Twitter, and Instagram accounts, and saw significant growth in a short period of time. We reviewed and monitored their social analytics and developed an assessment based on tactics that were successful and practices that needed to be altered.
Check out our case study on Blue Walter Baltimore’s social media growth below:
Data Analysis

Facebook (@BlueWaterBmore):
Based on the data supplied by Blue Water Baltimore, Blue Water Baltimore posts on Facebook significantly more during the morning (6-7am specifically). This, however, is not particularly effective. The minimum number of posts were shared at 12, 1 and 3 a.m. The maximum number of posts in one hour was 84 at 6 a.m. The average amount of posts within one hour was 21. However, the hours of the early morning are not the best timing based on the impressions of each individual post. Facebook defines post impressions as “the number of times your page’s post entered a person’s screen.” Ultimately, the graph above indicates that Blue Water Baltimore was not posting at the right times of the day, based on when their intended audience checks Facebook.
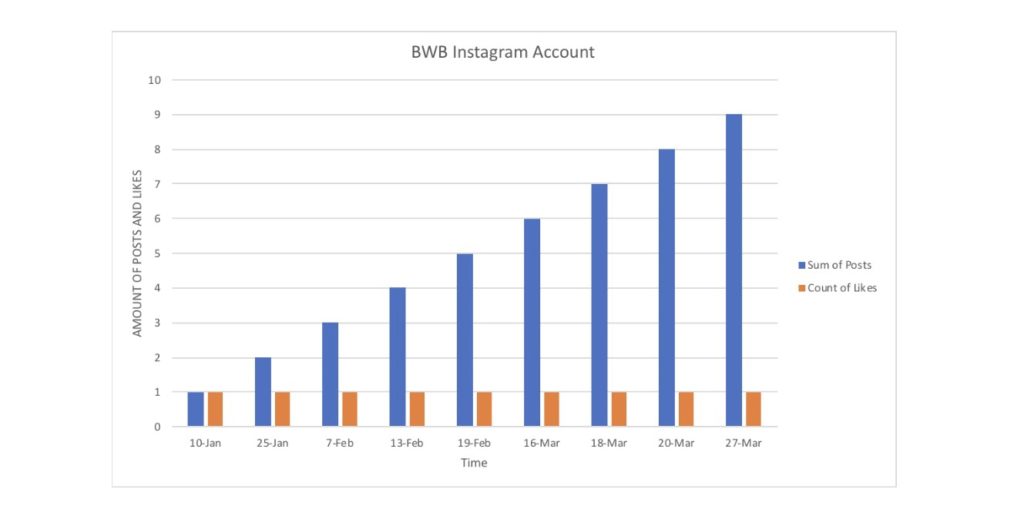
Instagram (@Bluewaterbmore)
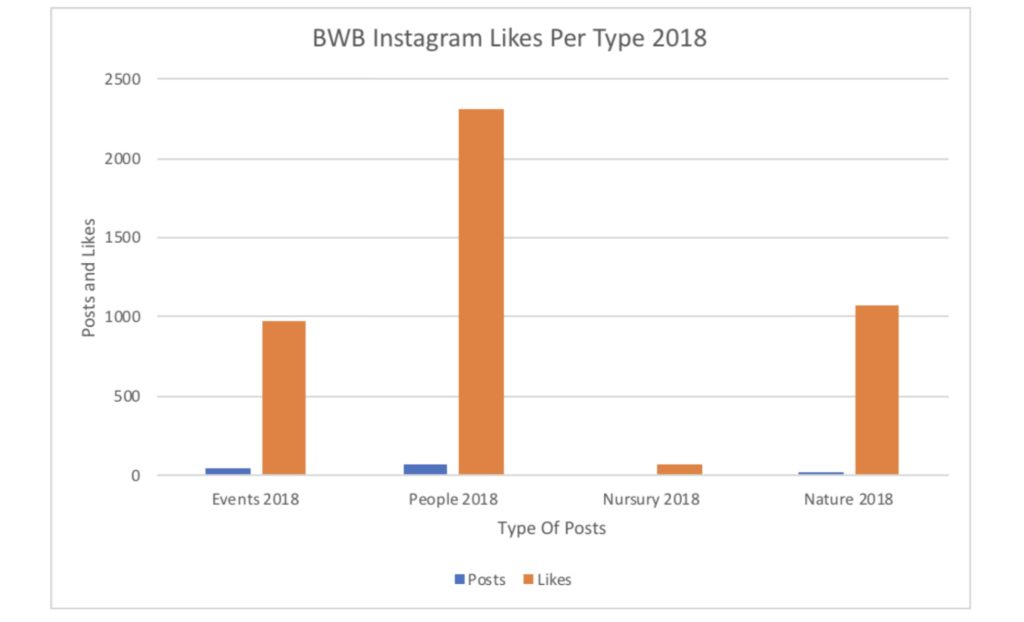
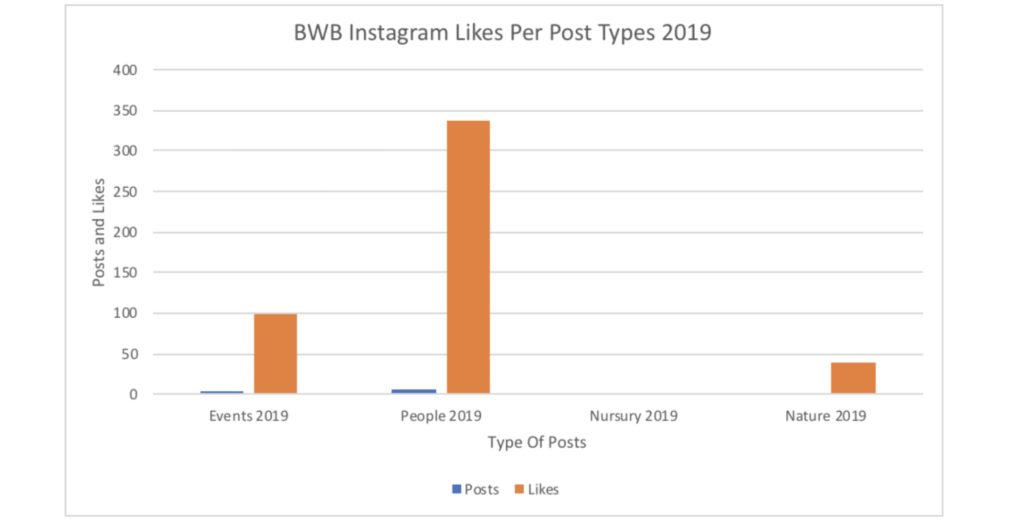
Based on the data from the BWB Instagram page, posts of people result in more likes. As the data shows, posts featuring people on BWB’s instagram ended up receiving the most attention (likes) by a large margin. The second most likes were on posts about events, which only received 99 likes.
The most important advantage an Instagram page provides is a platform to show the audience exactly what Bluewater Baltimore is all about. Looking at their posts, it seems some contain useful information about their services. There are more pictures than videos. Most of the pictures are not particularly high quality, not particularly relevant, nor are they inspirational or powerful. They do not effectively catch viewer’s attention. For example: BWB posted a picture on Instagram regarding World Water Day, which received only 32 likes and 0 comments.
Twitter (@BlueWaterBmore)
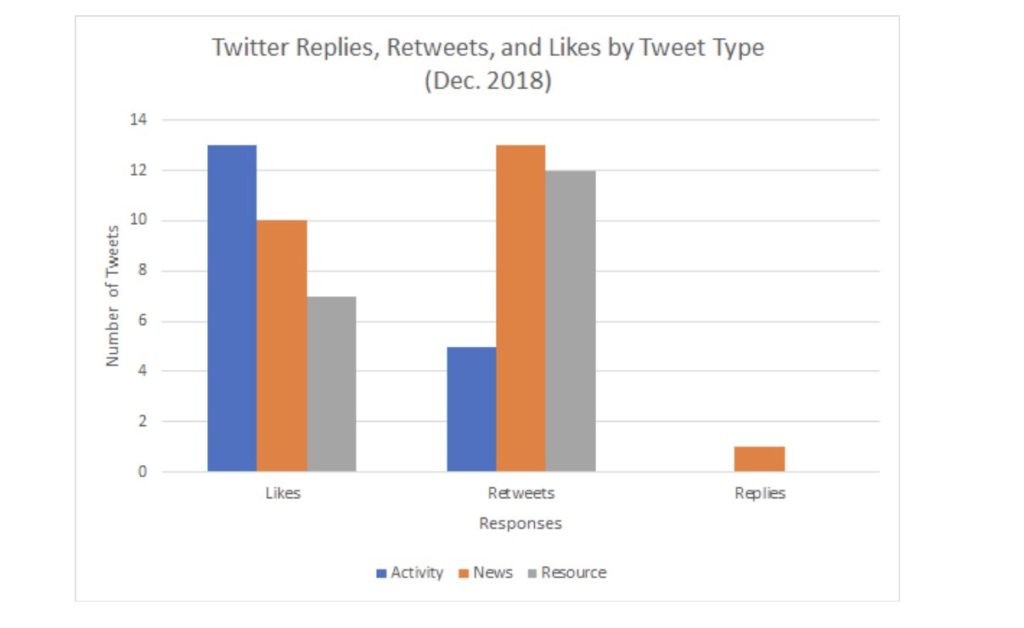
This chart references December 2018, which was the most recent full month of active data. Different kinds of posts generate different kinds of Twitter engagement. Posts about Blue Water Baltimore’s direct participation in events and activities received the most likes, followed by posts about relevant News. Informative news posts received the most retweets, followed closely by tweets containing resources. In all of December, there was only one instance of a BWB Tweet receiving a reply. While BWB has a basis for kinds of posts made, and has in the past made them actively, there has been lackluster engagement. The posts, similarly to BWB’s Instagram, do not attract larger audiences, and are not carefully constructed in order to garner or evoke any particular kind of response. Tweets about resources received the least amount of likes, but the most retweets, which makes sense, because a resource is both applicable and shareable.
What kinds of attention do different kinds of tweets from BWB garner?
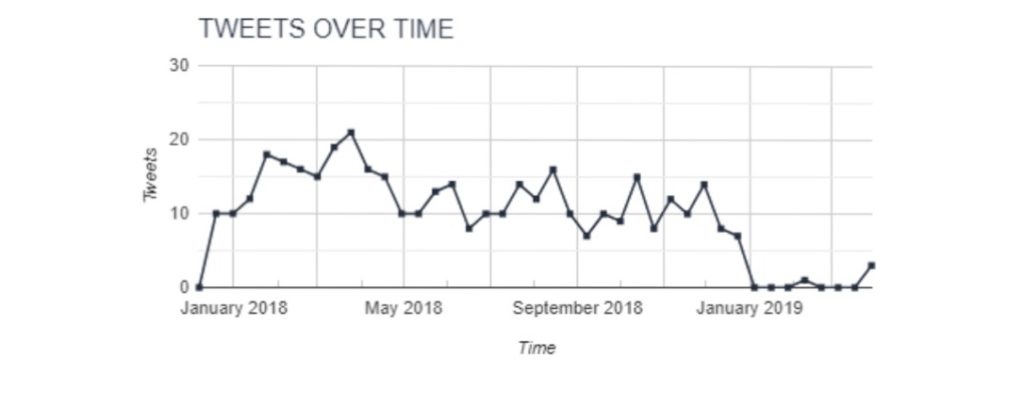
In what ways has BWB’s Twitter use/management affected engagement? This graph is an analysis of the last 400 BWB tweets over time. As the data shows, from January 2018 to January 2019, BWB’s Twitter was relatively active. After November 29, 2018, tweets over time gradually dropped until bottoming out at 0 tweets on January 4, 2019. BWB’s twitter account is essentially inactive right now, having only sent out 4 tweets since the end of December 2018. It is clear that @BlueWaterBmore is not an active presence on Twitter, and is not engaging any of its followers.
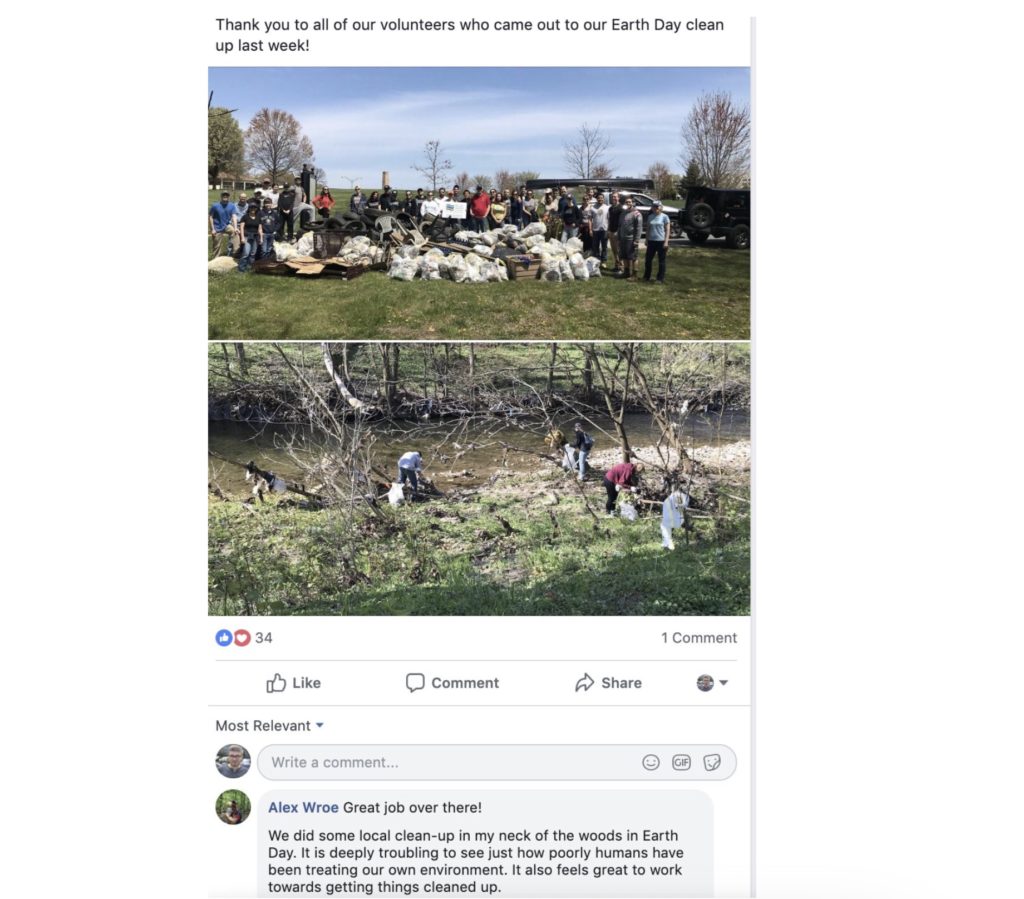
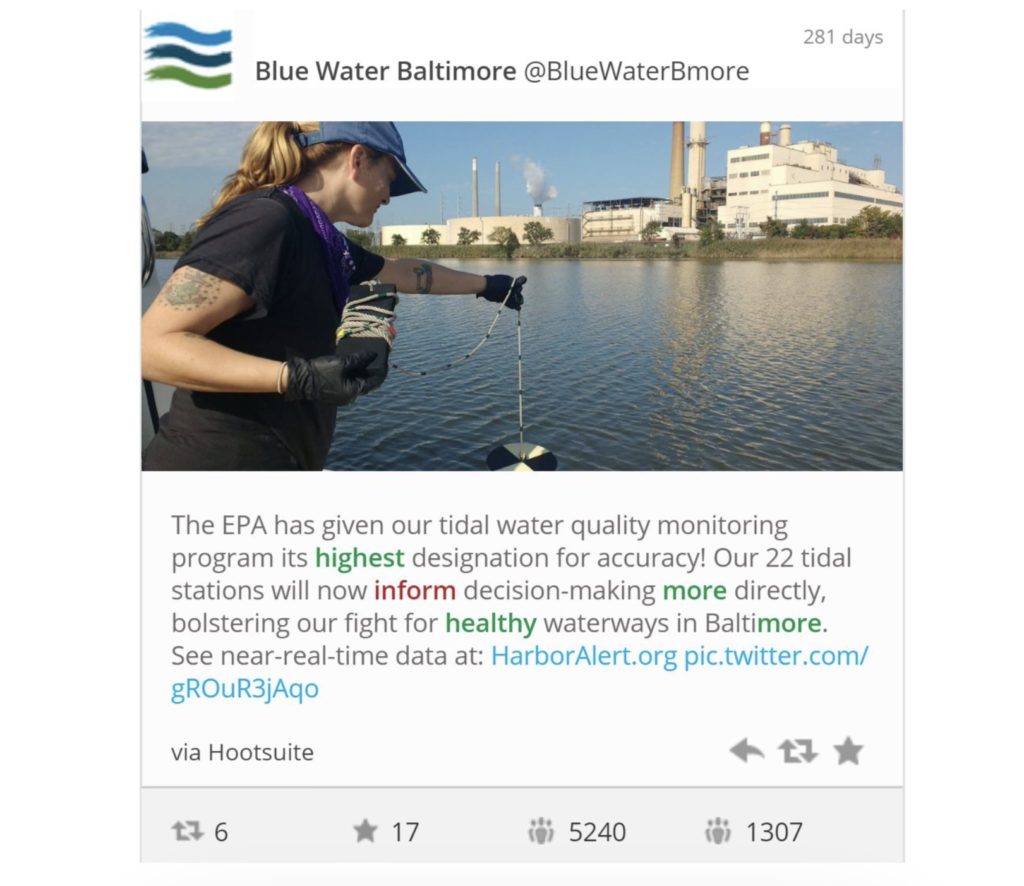
The post above is an example of a strong post by BWB. This post included original photos based on a positive action that BWB engaged in with community members. It was posted at 1:55 PM and received 18,837 impressions and one comment. In the future, the commenter could be engaged by BWB.
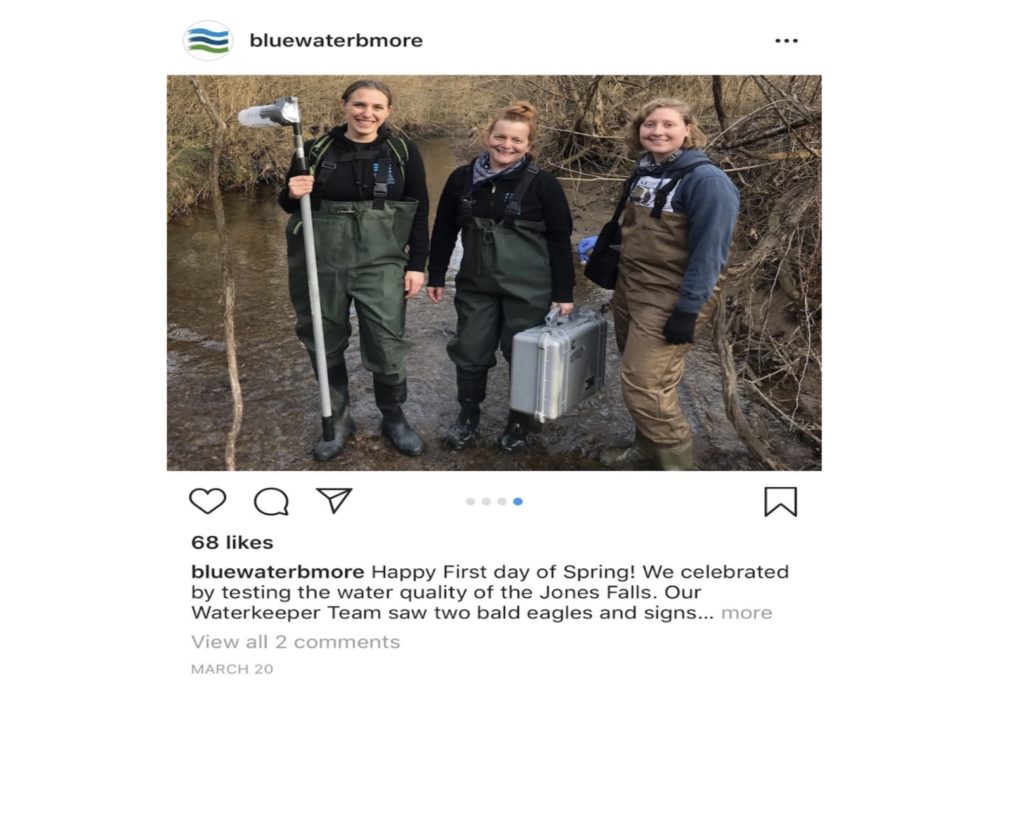
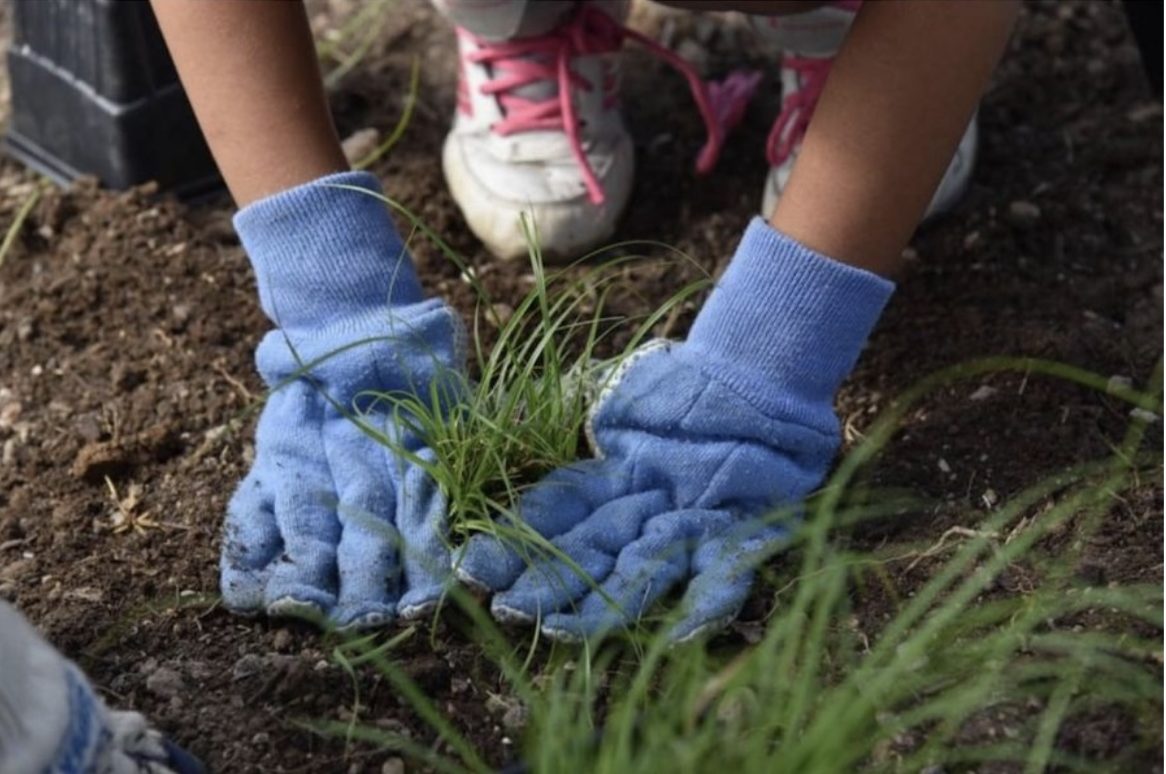
Above is an example of a strong post by BWB. The post includes volunteers that are working together to bring a change, which has a high number of likes compared to the other pictures shared.
The above tweet can be identified as a good tweet. It gives an update on something that BWB is involved with, and contains a photo of the subject of interest. It has 6 retweets and 17 favorites. It did relatively well for a post on BWB’s Twitter.
CALL TO ACTION
Facebook:
Blue Water Baltimore (BWB) is starting in a very advantageous position, given their already developed Facebook following. This requires however, an effective Facebook strategy in order to capitalize on the aforementioned following. Our primary recommendation for BWB’s Facebook page is to post during the afternoons or evenings, particularly at 1p.m. or 6p.m. This will likely increase post impressions significantly. Currently, BWB’s average lifetime Facebook post impressions is 2,703. It is feasible that moving to a consistent posting time of 1p.m. could raise their lifetime post impressions to an average of 7,688 (which is the average for 1p.m.). Facebook offers an option to schedule a post, which should be utilized to hit the 1p.m. or 6p.m. window. Our second recommendation is to interact with post commenters. This recommendation is not directly tied to data I analyzed but a best practice from ”Likeable Social Media“ by Dave Kerpen, who suggests responding to comments quickly and publically. This can be difficult due to staffing constraints, so prioritizing comments with higher levels of engagement is recommended.
Instagram:
There should have been more “Did you know…” posts, and posts with engaging questions, which would make BWB’s Instagram a source for valuable information to followers. They should also conduct live video streams which would help BWB interact with an audience through questions and polls. BWB needs to improve its Instagram page by providing keywords on hashtags. Inspire and expand the audience by posting pictures of volunteers in the community with vibrant colors. Provide lifestyle pictures to educate followers how to bring changes in their daily lives and save clean water for the future. Write better captions and post more photos of people, because those posts get the most attention.
Twitter:
Using the first set of data, it can be deduced that a Tweet containing parts of each category (News, Activity, Resource) could garner more attention for BWB’s Twitter. If tweets with attractive imagery, useful resources, and relevant information were to be sent out with consistency, it is reasonable to estimate based on the data, that these tweets would generate more overall engagement and attention in the form of impressions, likes, retweets, and replies. As post quality increases, these tweets could stimulate and re-engage the audience of BWB, and would likely contribute to an increase in followers, and ultimately exposure.
In regards to the second set of data, the clear and urgent next logical step in the improvement of BWB’s twitter account would be to immediately resume actively posting. As the account remains inactive, opportunities to capture the attention of followers and others are lost. BWB’s twitter becoming active again, paired with a new wave of thoughtfully constructed and consistent posts could serve to revitalize and perhaps even transform the twitter account, in terms of engagement, interest, and exposure. These results can be measured in terms of average likes, retweets, replies, which would likely increase in the time following the implementation of this plan of action. BWB’s twitter should be posting everyday, but not over saturating its follower’s feeds.